DATA SCIENCE USING PYTHON
ONLINE TRAINING COURSE
Moving Average
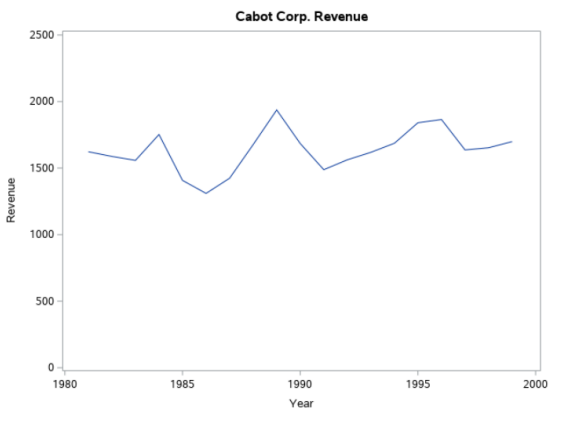
Let us consider the revenue from Cabot Corporation and see how we the Moving Average model can be useful to smooth the annual time series such as below.
By plotting the series, we can identify the factors affecting the movements. In the case of Cabot Corporation revenues, trend movement (long-term upward or downward) is obscured by the amount of variation from year to year.

To obtain the better overall impression of the pattern in the series like above, we need to smooth the series.
Moving Average for a chosen period of length L consist of series of arithmetic means computed over a period of time containing data for length L.
Say we choose L = 3 then
MA(3) = (Y1 + Y2 + Y3) / 3 for the first three years
MA(3) = (Y2 + Y3 + Y4) / 3 for the first three years and so on.
Consider following sample data:
4.0, 5.0, 7.0, 6.0, 8.0, 9.0, 5.0, 2.0, 3.5, 5.5, 6.5
MA(3) = (4 + 5 + 7) / 3 = 5.33
Now, this 5.33 is centered on the middle value – the second value of the series.
MA(3) = (5 + 7 + 6) / 3 = 6 is centered on the middle value – the third value of the series.
MA(3) = (7 + 6 + 8) / 3 = 7 is centered on the middle value – the forth value of the series.
and so on.
By doing this, no moving averages can be obtained for first (L-1)/2 year and last (L-1)/2 year. So in our case, first 1 year and last year will be having missing value.
| Data | MA(3) | MA(5) |
|---|---|---|
| 4 | ||
| 5 | 5.33 | |
| 7 | 6 | 6 |
| 6 | 7 | 7 |
| 8 | 7.66 | 7 |
| 9 | 7.33 | 6 |
| 5 | 5.33 | 5.5 |
| 2 | 3.5 | 5 |
| 3.5 | 3.66 | 4.5 |
| 5.5 | 5.16 | |
| 6.5 |